- Top Results
- Bosch Sensortec Community
- Discuss
- MEMS sensors forum
- Re: BME280 - Significant humidity error, issue has occured twice
BME280 - Significant humidity error, issue has occured twice
- Subscribe to RSS Feed
- Mark Topic as New
- Mark Topic as Read
- Float this Topic for Current User
- Bookmark
- Subscribe
- Mute
- Printer Friendly Page
BME280 - Significant humidity error, issue has occured twice
- Mark as New
- Bookmark
- Subscribe
- Mute
- Subscribe to RSS Feed
- Permalink
- Report Inappropriate Content
01-04-2021 11:11 PM
Hi,
I have a BME280 in an animal enclosure, monitoring temperature and relative humidity.
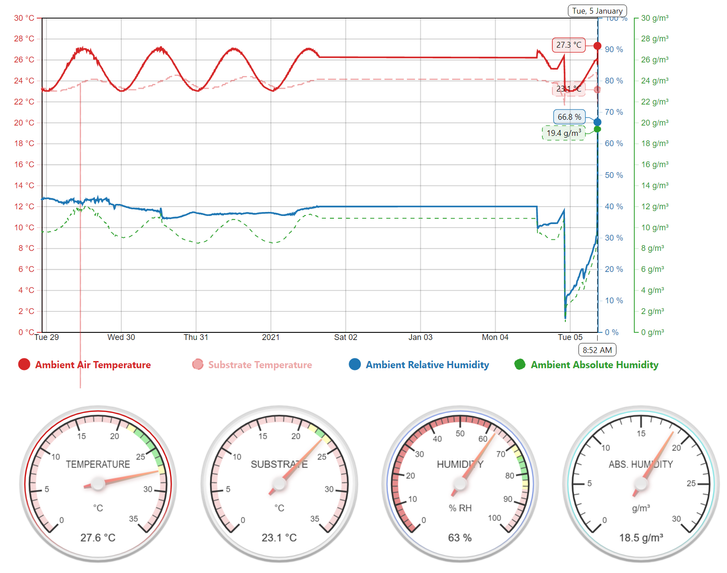
About 8 months ago, I noted that the RH was reading way lower than I had expected, but had assumed that it was correct. I changed out the sensor, and the readings went straight back to what I thought it should be. Last week, I noticed the issue again, but this time I had it trended. Unfortunately, it is still outside the history range (to the the left of the graph), but what happened was that the humidity plummeted on a step change from about 70% down to 40% and consistently read 30% low from then on. This can be seen as it hovers around 40% in the graph below. (the straigh horizontal lines were a loss of data connection) There was no obvious reason for the step change.
I shut down the system down last night and restarted it to get the first vertical line step change seen on the right of the graph, from 40% down to near 10%, which climbed over night to about 35% (about half of what it really is). With this poor performance, I swapped this sensor out with the original sensor that malfunctioned about 6 months ago, and the readings popped right back up to where it should be.
So what is happening here? The sensor is mechanically protected, all the connections are heat shrunk and terminated properly. The only abnormal thing is that the sensor is in a relatively high humidity environment constantly. Am I operating the sensor out it's specification or what?
Any input would be appreciated.
Thanks!
Rob
- Mark as New
- Bookmark
- Subscribe
- Mute
- Subscribe to RSS Feed
- Permalink
- Report Inappropriate Content
01-11-2021 11:09 AM
How is the graph above not real time data? Not even sure what 'reference device values' is.
Only trying to provide constructive user feedback, if I have to swap a sensor every 6 months, so be it, but it seems there is some sort of hardware issue considering swapping the unit out fixes the problem.
I think I will leave it at that.
Thanks.
- Mark as New
- Bookmark
- Subscribe
- Mute
- Subscribe to RSS Feed
- Permalink
- Report Inappropriate Content
01-12-2021 03:16 AM
Hi Sir:
You could offer the real time historic data and the same time of reference value, need these data to do further analysis.
Based on the graph, of course, we can know what happened, but don't know the reason why this phenomenon occurred, so it is necessary for us to analyze the raw data and reference value in order to get the cause.
- « Previous
-
- 1
- 2
- Next »
Still looking for something?
- Top Results
